Choosing an analytics tool — competitive analysis

October, 2025

The Problem

Most features and ideas can be random, mostly from the co-founders, with no objective data to back their hypothesis. We the employees act like mercenaries and not missionaries, going ahead to implement what we’ve been told, coupled with no way to also track how effective the solution is.

Most of our product directions and decisions are prompted by deals and clients’ requests, with a rationale: money matters, business and sales is mostly all there is afterall.

We then end up having feature loaded products or abandoned products.

The Goal

  • Find a way to measure product metrics, choosing the most suitable analytics tool.
  • Be able to suggest product features or iterations by tendering evidences and data.
  • Show, very carefully, how design improvements translate to business impact. So it doesn't overlap with marketing and sales reps efforts.

Choosing a Tool

I researched and made a list of the most used analytics tools across different disciplines, globally. The goal is to find what aligns with our priorities:

  • Less cost
  • Ease of use and clarity of data
  • Fit for the company's use-case; audience and growth stage
  • User behavioural analytics: funnel analysis, cohort analysis etc.
Feature / Tool
Amplitude
Mixpanel
Pendo
Google Analytics (GA4)
PostHog
Hotjar
1. Primary Focus
Deep behavioral product analytics & experimentation
Granular event-based mobile & web analytics
Product adoption, in-app guidance, and analytics
Broad web traffic, audience & marketing attribution
All-in-one open source product analytics suite
Qualitative data (heatmaps, recordings, surveys)
2. Core Value Prop
“The Why” behind user behavior; complex journey mapping; data governance.
Real-time, action-oriented, and highly customizable event analysis.
Unifying analytics with in-app engagement (guides, NPS, feedback).
Free, widely-adopted, strong with marketing data and traffic sources.
Full-stack, self-hosted option for full data control; privacy-focused.
Visualizing user frustration/delight; understanding the “how” and “why” of UX.
3. Data Model
Event-based, user-centric
Event-based, user-centric, with focus on feature usage and accounts
Event-based (GA4), historically session/pageview-based (UA)
Event-based, full-stack (with features like feature flags)
Session-based (recordings, heatmaps), survey responses
4. Key Features
Funnels, Cohorts, Retention, User Journeys, Data Governance, Experimentation, AI Insights.
Funnels, Cohorts, Retention, Real-time reporting, Custom Properties, Impact Analysis.
Funnels, Feature Usage, In-App Guides/Tooltips, NPS/Surveys, Account-level Analytics.
Traffic Sources, Conversions, Audience Demographics, deep integration with Google Ads/BigQuery.
Funnels, Feature Flags, A/B Testing, Session Replay, Heatmaps, Surveys, Self-hosting.
Heatmaps, Session Recordings, Surveys/Feedback Widgets, Incoming Feedback, Interviews.
5. Setup & Implementation
Manual event instrumentation required. Steep learning curve for advanced features. Requires significant dev work.
Manual event instrumentation required. Dev setup needed for custom events. Faster reporting than some.
Requires SDK installation. Some event tagging is visual/no-code, but deep analytics needs dev.
Simplified setup for basic web, but deeper product-style event tracking requires dev effort.
Self-hosting is complex, but cloud/open-source is relatively straightforward for technical teams.
Very easy. Mostly a single-script install. Minimal dev required for core functionality.
6. Qualitative Data
Limited (relies on integrations)
Yes (in-app surveys, NPS, feedback widgets)
No / Limited
Yes (session replay, heatmaps, surveys)
Core strength (session replay, heatmaps)
7. Pricing Model
Free tier (generous), then quote-based (typically enterprise/high-growth scale). Expensive at high volume.
Free tier (generous events), then tiered/usage-based (by event volume). Scales well for startups/mid-market.
Quote-based (often based on MAUs). Tends to be mid-market to enterprise-focused.
Free to use (GA4). GA360 (paid enterprise) for high limits/advanced features.
Open source (free), cloud (usage-based by events/replays). Very affordable or free for low usage.
Usage-based (by daily sessions/replays/surveys). Affordable for small to mid-sized teams.
8. Target Audience
Mid-market to enterprise SaaS, e-commerce, B2C apps with high data volume. Data-savvy teams.
Startups, mid-market SaaS, and mobile app teams focused on product iteration speed.
B2B SaaS, customer success, product/UX teams focused on feature adoption and onboarding.
Marketing teams, webmasters, teams needing basic, free web traffic analysis.
Technical startups, teams with strong privacy needs, developers who value open-source.
Product/UX teams, designers, marketers focused on website/landing page usability.

Key Insights

  • The tools are not direct competitors: Pendo is a product experience platform, Amplitude is enterprise product analytics, Mixpanel balances strong capabilities and simplicity, Google Analytics is marketing-focused, PostHog is all-in-one open source, and Hotjar is qualitative/UX.
  • Of all these, Amplitude, Mixpanel, and Pendo are tools that satisfactorily offer the required product features. However,
  • Amplitude is suitable for large enterprises and B2C products with high-velocity data and diverse product portfolios. It can also be quite expensive with a steep learning curve.
  • Mixpanel is suitable for early-stage startups with a focus on the MVP & iteration. It also offers a very generous free tier.
  • Pendo is suitable for mid-size growth stage to enterprise companies, with significantly more cost than Mixpanel.
Recommendation: Mixpanel is perfect for our use case.

Execution

I met with an account executive from Mixpanel to discuss the service offerings’ alignment with our expectations.
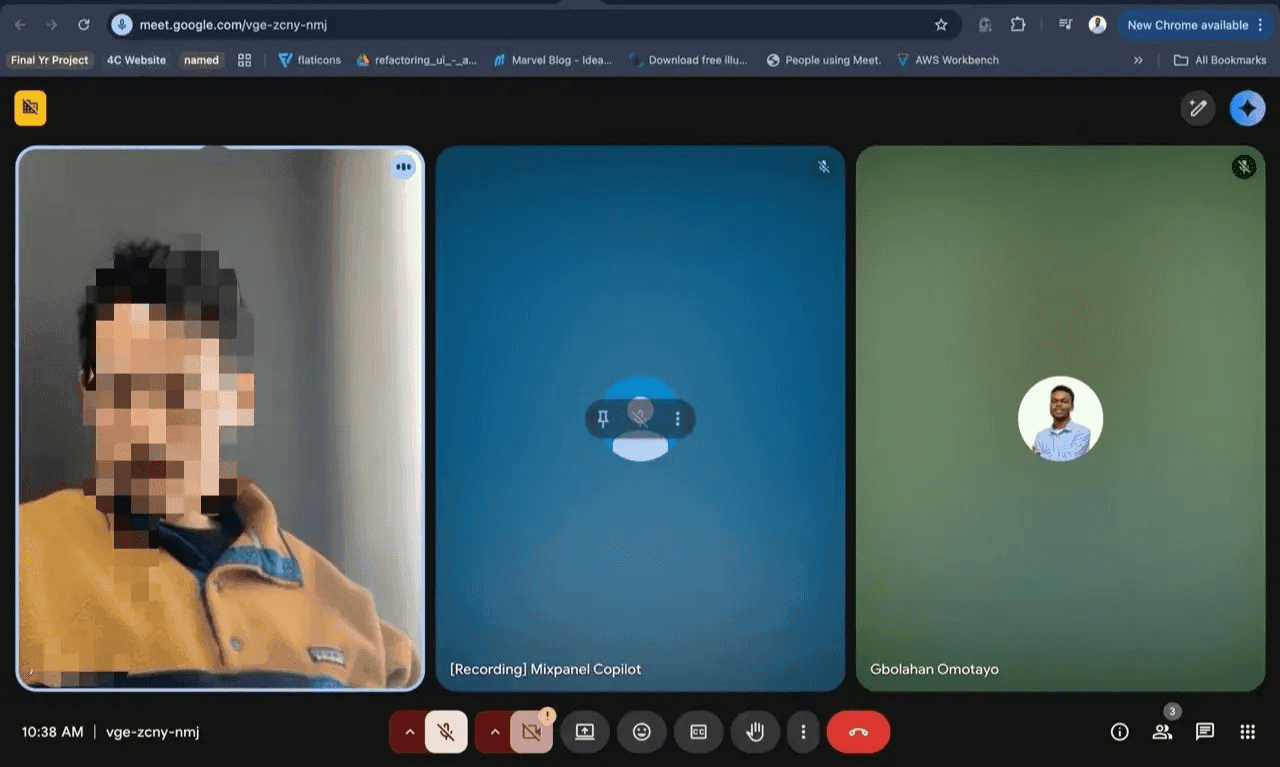
Google Meet call with a Mixpanel account executive

Key points from the conversation

  • They answer the ‘Whys’ behind the metrics via Session Replays and Heatmaps.
  • Their free tier is quite generous, allowing up to a million monthly events and up to 10k session replays.
  • They can handle cross-platform interactions but will require a manual add-on to track WhatsApp experience.
  • Can handle experimentations not directly but via Feature flags and Experiment analysis. The product is capable of making recommendations based on the outcome of the experiment.
  • Generally, Mixpanel offers a lot of granular analysis that significantly suit our needs as a product company.

The account executive is willing to conduct a 1-hour product demo with the team and key decision-makers next week, and to also discuss pricing and further needs. I am, however, leaning towards exhausting the free tier before having that call. I’ll continue to go through Mixpanel’s publicly available documentation and demos to get us started.

I presented physically to the internal team consisting of the product managers, the lead engineer, and the chief technology officer, for early buy-in.

The team is aligned with the adoption of Mixpanel. We will test run with our first B2C, Goodpill. If successful, we intend to adopt across all products by 2026.

See next:Top 5 lessons from carrying out User research